The Dashboard
Read your performance at a glance — KPIs, charts, orders and the trading calendar.
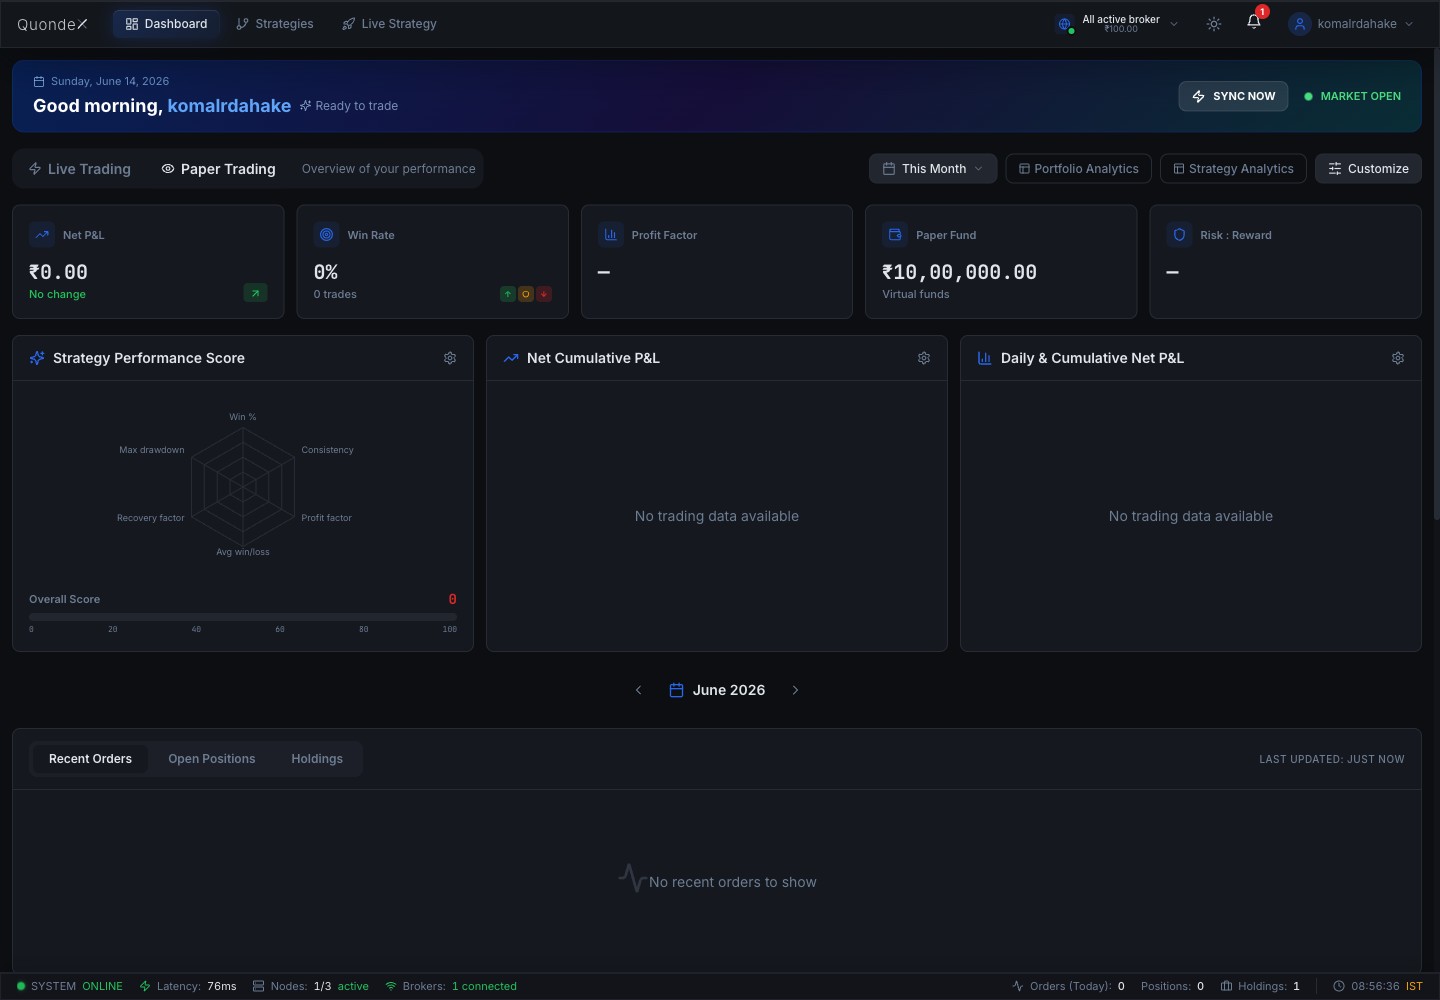
The Dashboard is your command center. It shows live performance for the selected mode (Live or Paper) and broker.
Live vs Paper toggle
At the top, switch between Live Trading and Paper Trading. Every KPI, chart, position and holding below updates to the selected mode — paper data never mixes with real broker data.
KPI cards
- Net P&L — realised + open (MTM) profit/loss for the period.
- Win Rate — share of winning trades, with the win/loss split.
- Profit Factor — gross profit ÷ gross loss.
- Account Balance — broker balance (Live) or virtual funds (Paper).
- Risk : Reward — average reward per unit of risk.
Time range & month navigation
Use the This Month / This Week / … dropdown to set the analytics window. The ‹ June 2026 › navigator below scopes Recent Orders, Positions and Holdings to a specific month.
Widgets
- Strategy Performance Score — a radar of win %, consistency, profit factor, payoff, recovery and drawdown.
- Cumulative & Daily P&L charts.
- Recent Orders / Open Positions / Holdings tabs.
- P&L by Day / Symbol / Hour, Trade Duration, Drawdown, and a GitHub-style Progress Tracker calendar.
Click Customize to show/hide any widget. Use Sync Now to pull the latest funds, positions and orders from your broker.
Was this page helpful?